 Sereno Routing guide
4. Reading a route
The map shows where the route goes and what the weather does around it. The Data face holds the numbers.
The routes list
The Plan tab lists your routes, newest first. Each shows a line per model: the distance in nautical miles, the hours at sea, the strongest wind in knots, the worst comfort, how many legs are flagged as over a comfort threshold, and the hours under motor. Below that, how far apart the models' tracks run and which forecast run each used.
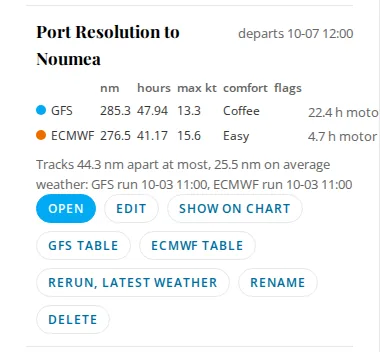
- Open opens it on the map. Show on chart draws it on the map beside others without opening it.
- GFS table and the other model tables open the leg-by-leg table in a sheet, with a Columns chooser.
- Edit, Rerun, latest weather, Rename and Delete do what they say. See Edit, move and run again.
The Boat page lists the same routes in a table with their state: Queued, Running, Done, Partial or Failed.
The route on the map
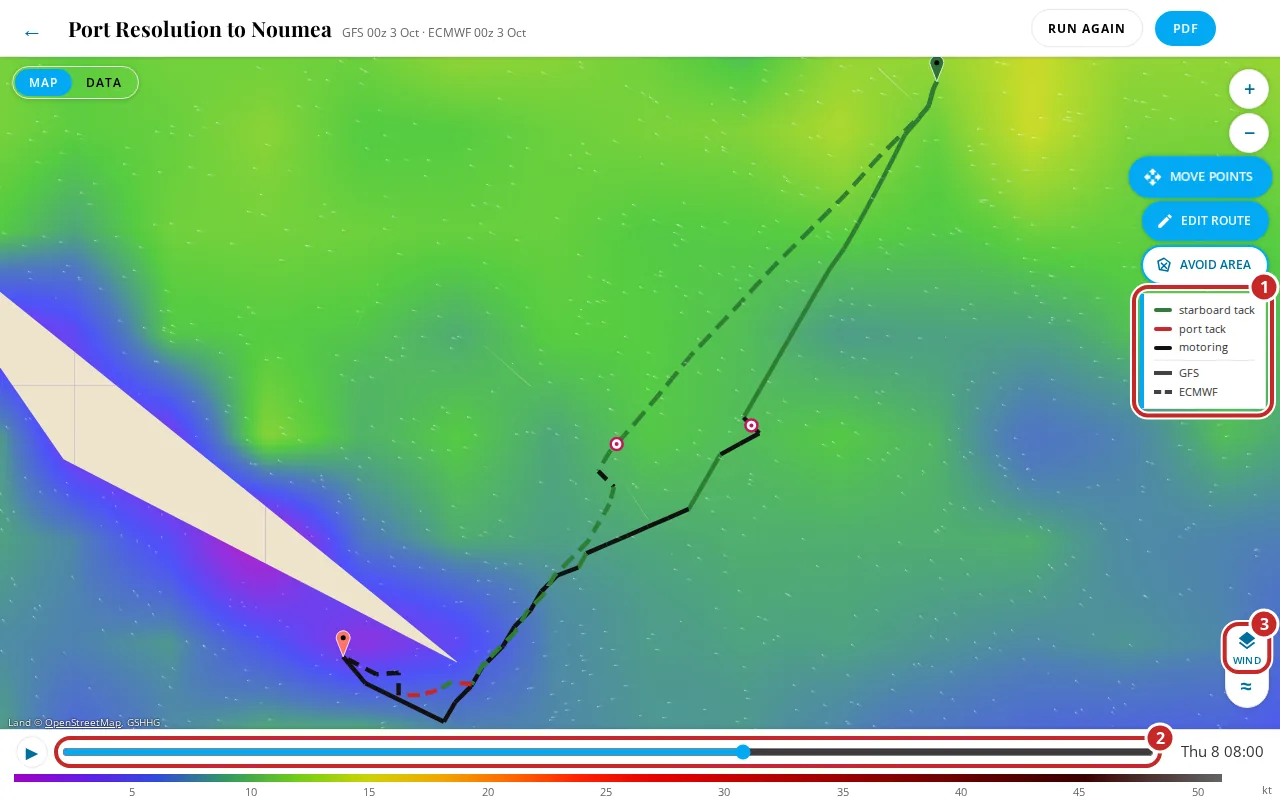
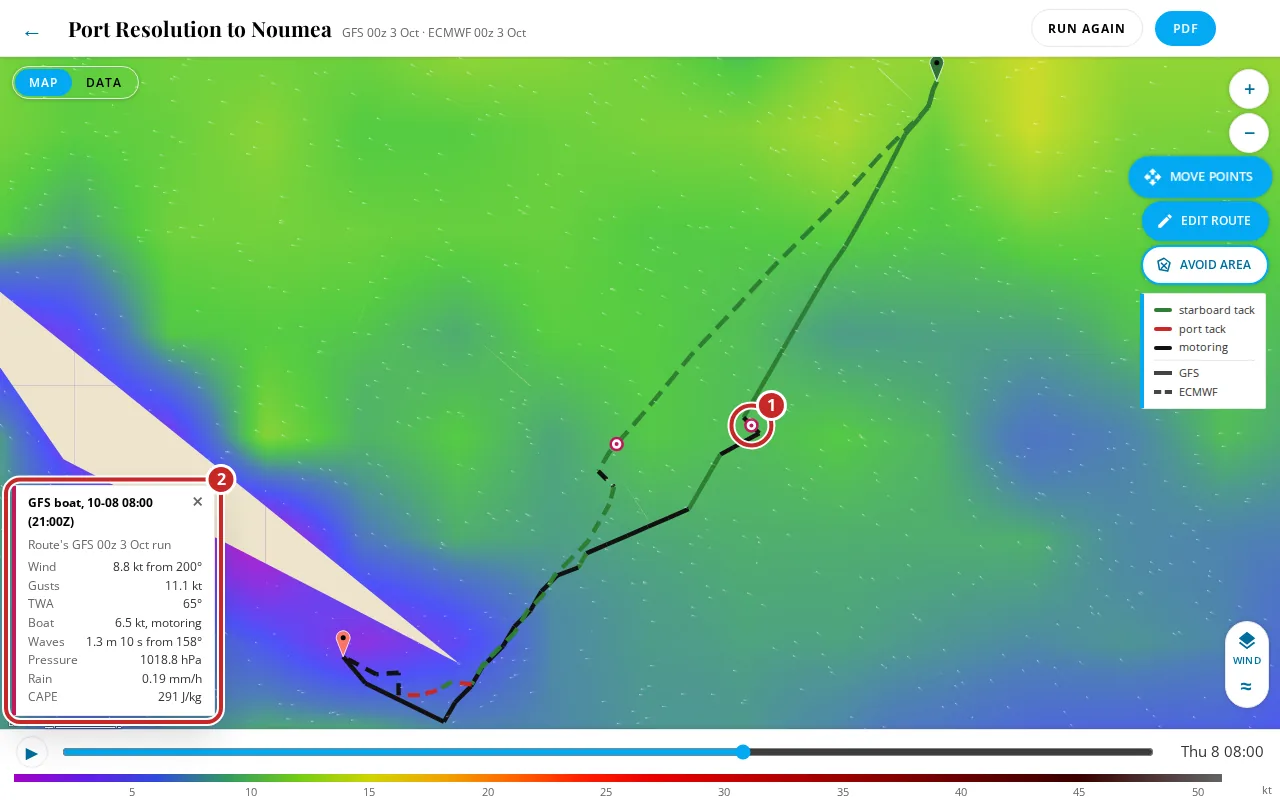
- The key (1): green is starboard tack, red is port tack, black is under motor. GFS is drawn solid, ECMWF dashed and AIFS dotted. Depth warning appears when the route has depth marks.
- The slider (2) sets the time for the weather on the map and moves a boat along each route to where it would be. Drag it, or tap play to run it forward. The time beside it is local.
- The layer button (3) chooses the weather shown under the route. The button below it, ≈, turns the moving streaks on and off.
The title bar shows the route's name and the forecast run each model used, with Run again and PDF at the right. ← goes back to the list.
Weather layers
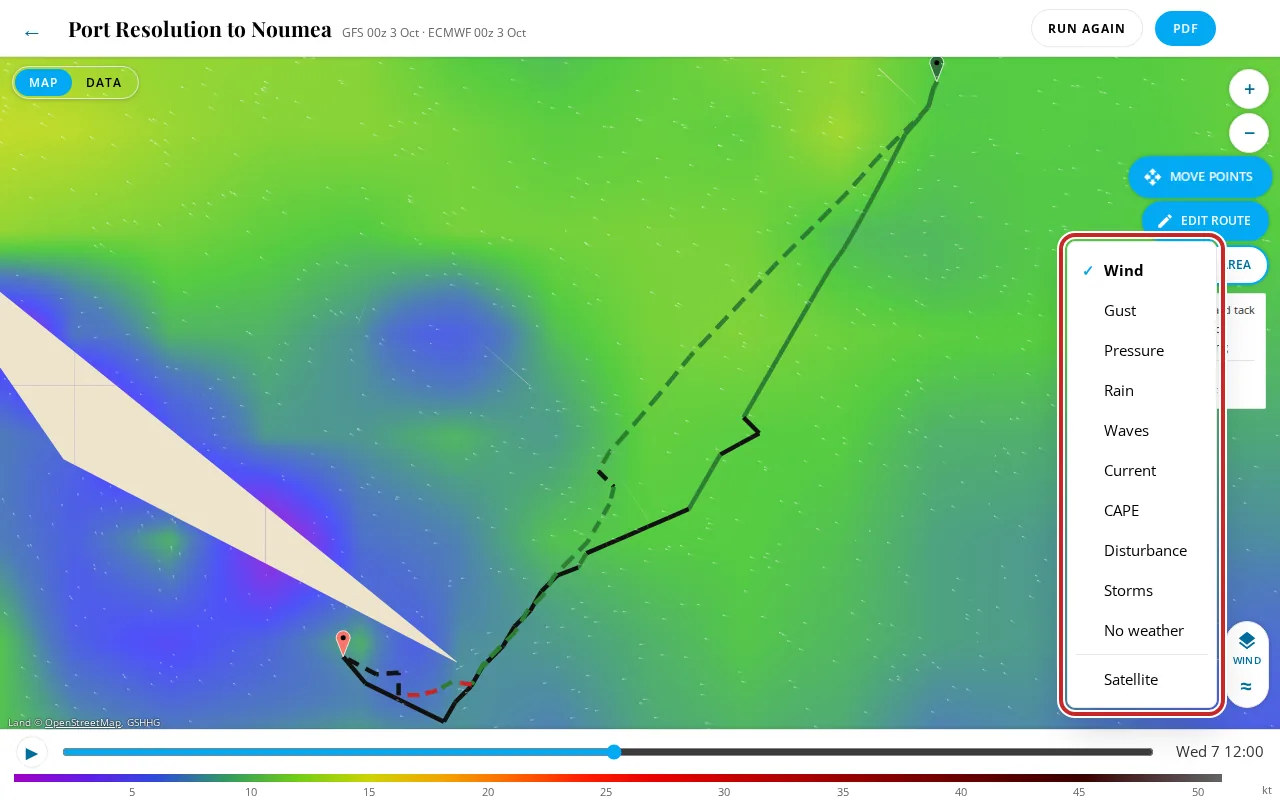
| Layer | Shows |
|---|---|
| Wind | True wind speed in knots, with streaks moving downwind. |
| Gust | Gust speed. |
| Pressure | Sea-level pressure, with isobars. |
| Rain | Rain rate. |
| Waves | Significant wave height. The streaks follow the wave direction. |
| Current | The RTOFS surface current, whichever model is shown, as moving particles. The slider runs to the end of the current forecast. |
| CAPE | Convective energy: high values mean squalls and thunderstorms are possible. |
| Disturbance | The air's spin at 850 hPa, about 1,500 m up, with the strongest areas outlined: one of the signs of an upper air disturbance. See Storms and upper air disturbances. |
| Storms | The official tropical cyclones: position, strength, forecast track, cone and wind radii, over the wind at half strength. See Storms and upper air disturbances. |
| No weather | The plain map. |
| Satellite | Cloud-free satellite imagery under everything else, to see reef and shore. It's separate from the weather layers. |
The weather follows the map as you pan and zoom, with a loading box while it arrives. A model that lacks a layer (AIFS has no waves) shows wind instead and says so.
Storms and upper air disturbances
Two layers show what may be developing. They're for looking, and for the notes on routes and planner days. Neither changes a route; see Storm and disturbance notes.
Storms
The Storms layer shows the tropical cyclones the official warning centers are tracking. The router reads them about every 6 hours from:
| Center | Covers | Gives |
|---|---|---|
| NOAA National Hurricane Center | The Atlantic and the east and central Pacific | Position, strength, forecast track to 5 days, the cone, wind radii at 34, 50 and 64 kt |
| Japan Meteorological Agency | The northwest Pacific, numbered storms only | Position, strength, forecast track to 5 days with a probability circle at each point, wind radii at 30 and 50 kt |
| Fiji Meteorological Service (RSMC Nadi) | The southwest Pacific | Position, strength and forecast positions to 24 h. No cone or radii. |
| Joint Typhoon Warning Center | The west Pacific, the Indian Ocean and the Southern Hemisphere | Position, strength, forecast track, wind radii at 34, 50 and 64 kt. No cone. |
A storm two centers cover is shown once, from the first of NHC, JMA, RSMC Nadi and JTWC that has it. Nadi's and JTWC's bulletins come through the US National Weather Service's copy of them. A bulletin more than 18 h old isn't shown.
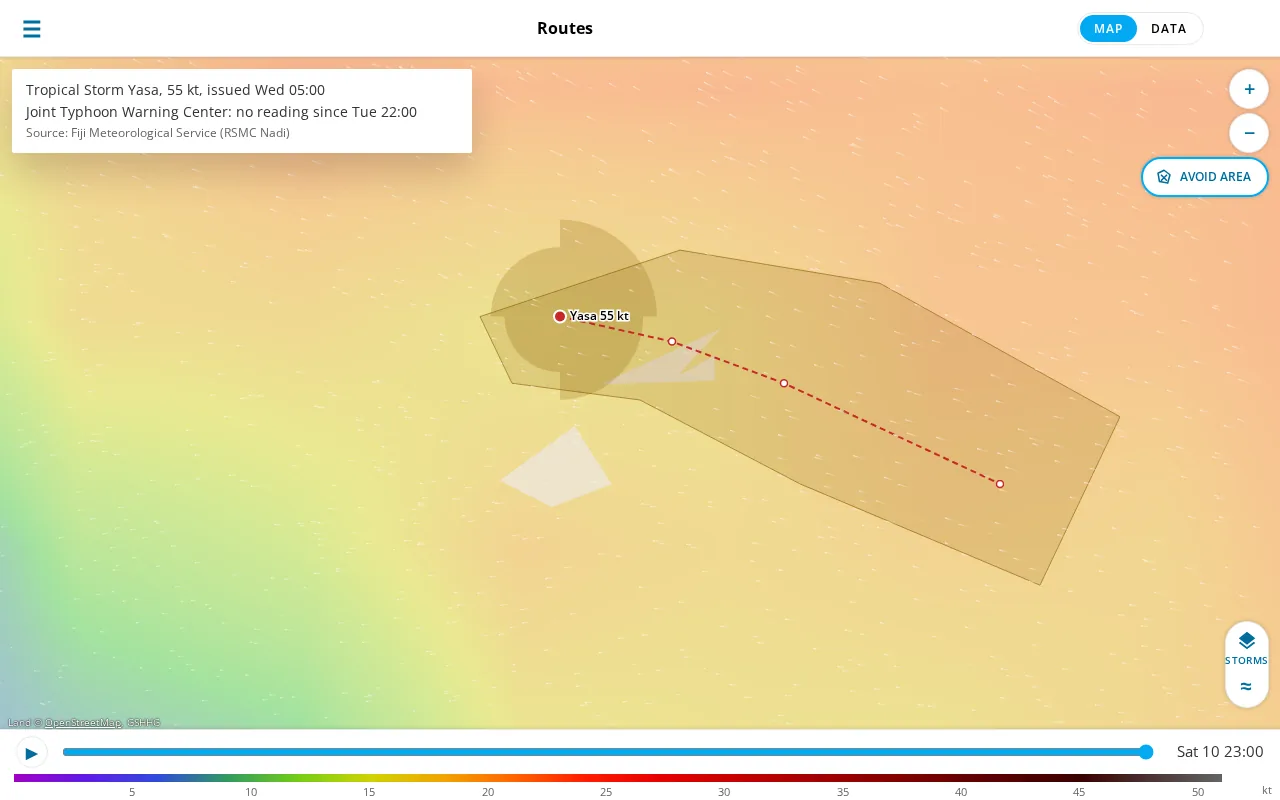
On the map, each storm has:
- A red marker at its position, labeled with its name and wind, for example Yasa 55 kt.
- The forecast track as a dashed line through a ringed point for each forecast time.
- The cone shaded amber, where the center gives one (JMA's is its probability circles).
- The wind radii as a wedge for each quarter: the widest is 34 kt (30 kt from JMA), darker for 50 kt, and red for 64 kt.
Hover over a marker for its strength, issue time and center, and over a forecast point for its time and wind. The wind colors under the layer are at half strength, so the storms stand out.
The note box over the map lists the storms in view, each with its issue time in your time zone, and the centers' credit under them: Hurricane Simon, 80 kt, issued Tue 03:00. It moves to the foot of the map when it would cover a marker. On a phone it's one line, the storm or 2 storms in view; tap it for the list. No storms in view means none of the storms held is in the part of the map you're looking at. A center whose last reading failed is shown from the reading before, for up to 12 h, and the box says no reading since and the time.
Disturbance
The Disturbance layer colors the spin of the air at 850 hPa, about 1,500 m up: the relative vorticity averaged over a 150 km box, in 1e-5 per second, counted only when it turns the way lows do in that hemisphere (clockwise in the south). It comes from the newest upper-air run the router holds of the model shown, for 7 days in 6-hour steps, and follows the slider.
Areas at 8e-5 per second or more within 30 degrees of the equator are outlined. The outline is the spin alone, one sign among several. A note on a route takes more: a closed low, 36 h of life, low shear, a warm core, and the moisture and CAPE for deep convection (the rule), so most outlined areas never become a note. The line under the map says what's drawn, for example Spin at 850 hPa in 1e-5 /s, 150 km average (the model's own vorticity). Outlined: 8 or more between 30 degrees south and 30 degrees north. Spin is one of the signs an upper air disturbance is read from, with a closed low, low shear, a warm core and CAPE; on its own it isn't one. GFS 06z., followed by the model's credit.
The boat box
Click or tap a boat on a route to see its conditions at the slider's time: the wind, the true wind angle, the boat's speed and tack or motor, the waves, the current and how much of it runs along the course, and CAPE. It's read from the route's own table and follows the slider.
Weather at a point
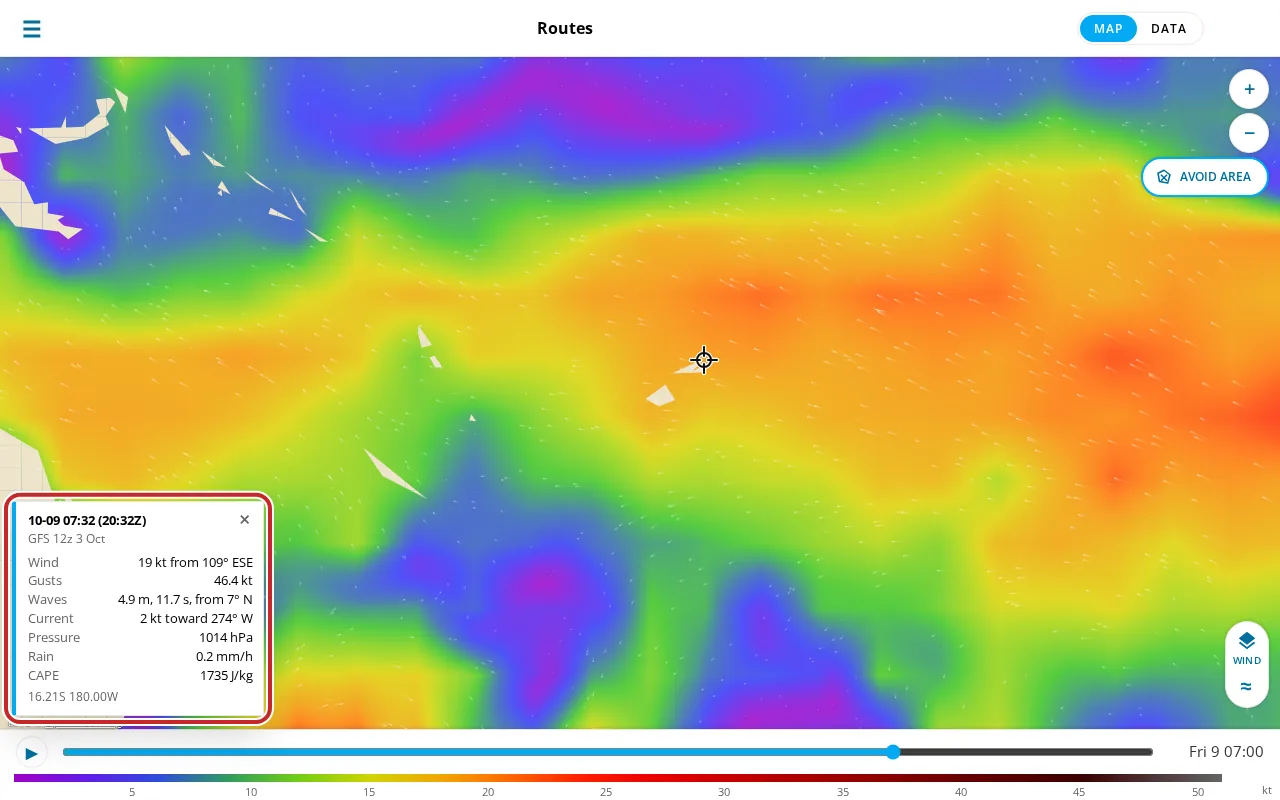
Click or tap anywhere else on the map for the weather there at the slider's time: wind, gusts, waves, current, pressure, rain and CAPE, from the model shown. Drag the crosshair to move it; the close button shuts the box.
The Data tabs
Tap Data in the top left of the map to switch to the numbers, and Map to go back. The tabs run along the top as words, the open one underlined: Graph, Wind, Summary, Wave, Current (for a route planned with current), Atmosphere and Export. Every value is in your own units from Settings.
The tables show one model at a time. A switch above the table chooses GFS, ECMWF or AIFS, and the choice stays as you move between tabs. Every column is there: the tables scroll sideways, and the time column stays put while you do. Rows are grouped under the day, the time shows as hours and minutes, and night legs are shaded with a moon.
Graph
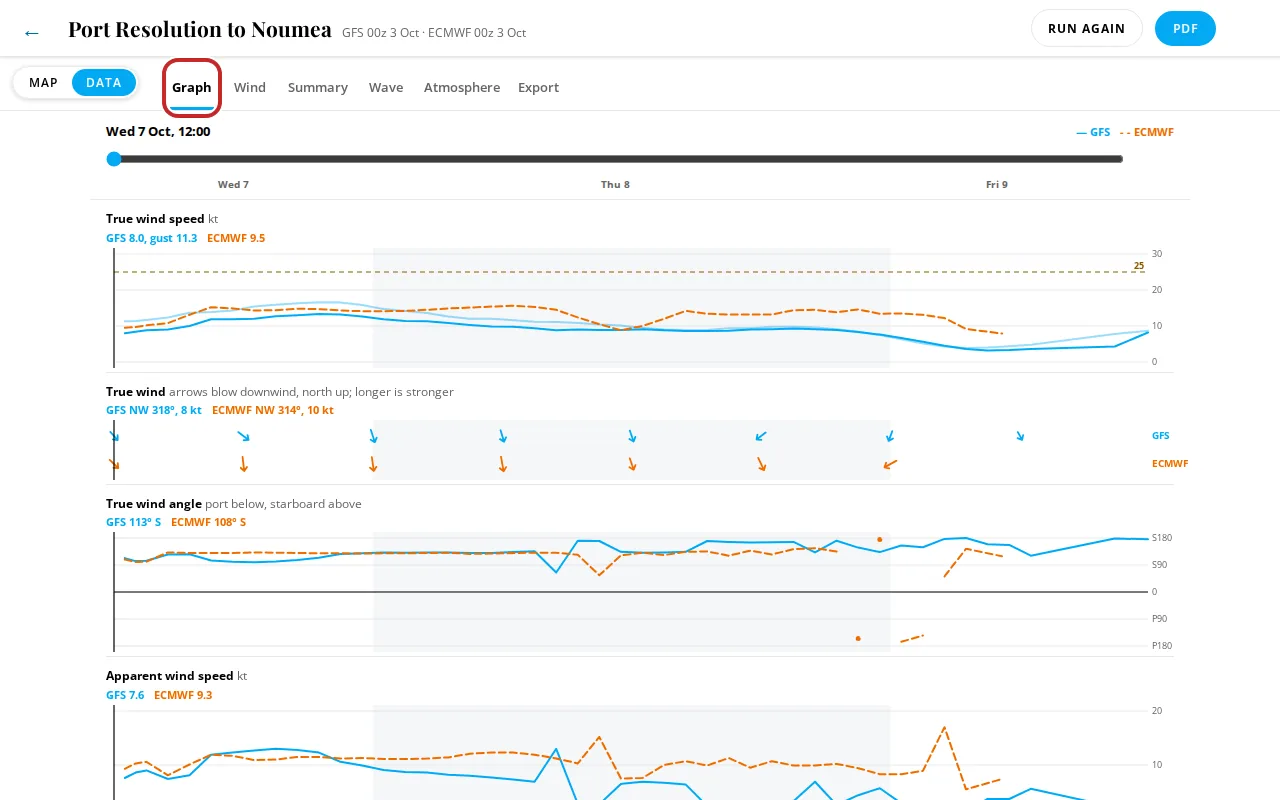
Every value along the passage on one time axis, a line per model: GFS solid, ECMWF dashed, AIFS dotted. Alternate days are shaded. Drag the time slider at the top: a line moves through every chart, and each chart reads out each model's value at that moment.
Wind direction, the seas' direction and the current's set are rows of arrows, one row per model, one arrow every 6 hours of the passage, with north up. Wind and sea arrows point the way the wind blows and the seas run; current arrows point the way the water flows. A longer arrow is stronger wind, higher seas or faster current.
Seas on the boat shows your boat every 12 hours, pointing up as it's heading, with an arrow where the steepest part of the sea, wind sea or swell, meets it: on the bow, the forward quarter, the aft quarter or astern. Seas on the right of the boat are on starboard. The outline follows your hull type in Settings. Steep seas on the bow are the roughest. The i button explains the models.
Wind
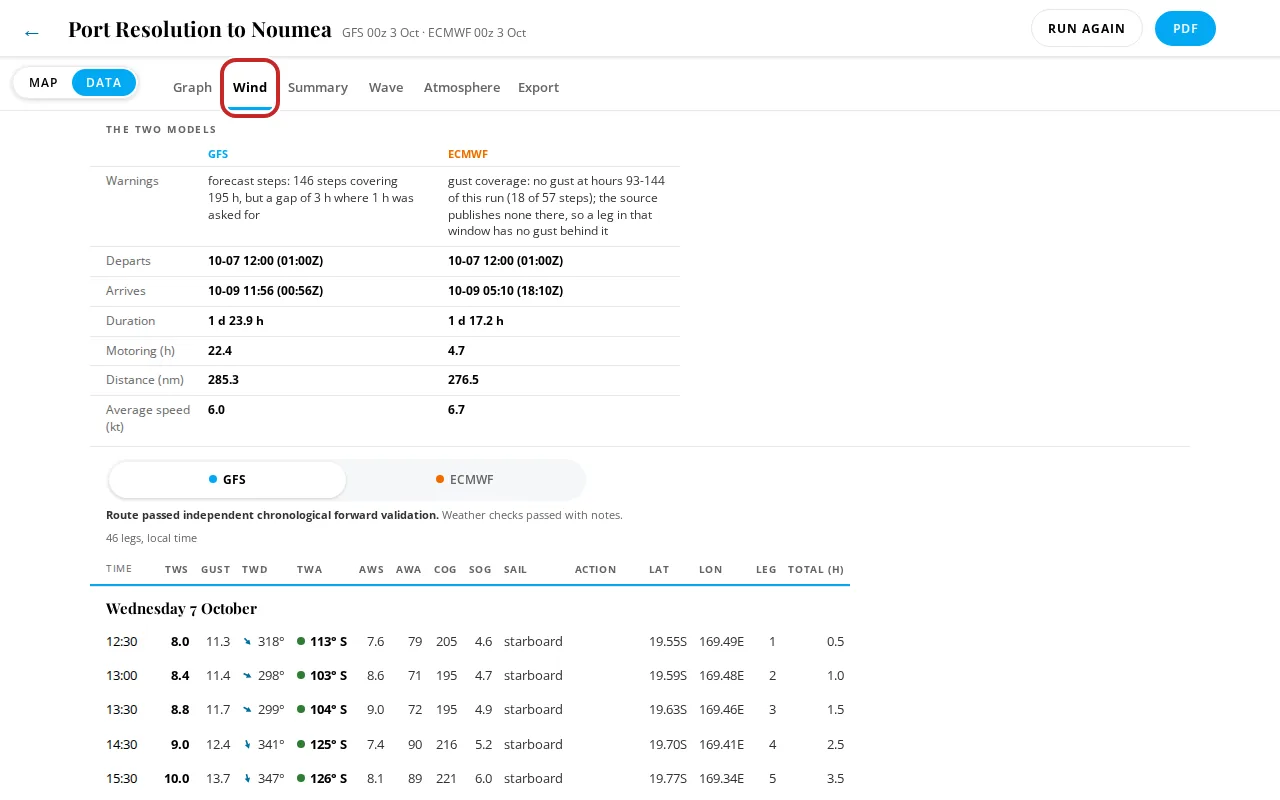
The models compared first: warnings, ocean current, departure and arrival, duration, motoring, distance and average speed. Then the chosen model's every leg: true wind and gusts, the wind's direction with an arrow, the wind angle with a red dot on port and a green dot on starboard, the apparent wind, course and speed over the ground, current, the sail and any action (tack, gybe, motor on or off), and at the end each leg's position, number and hours from the start.
Summary
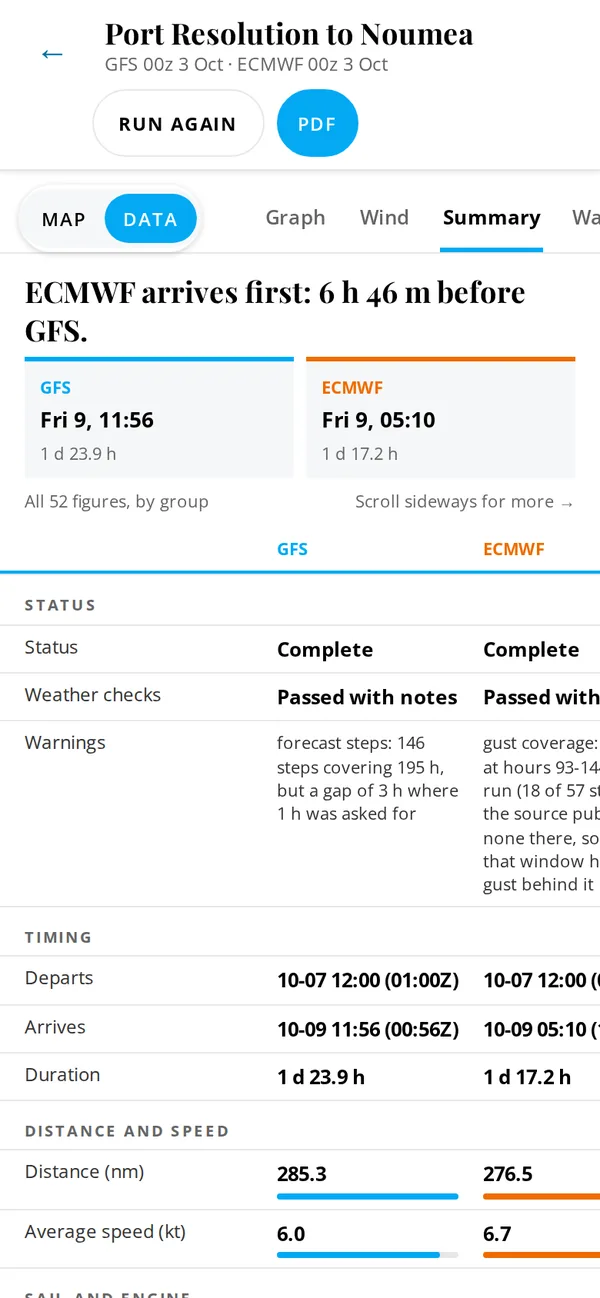
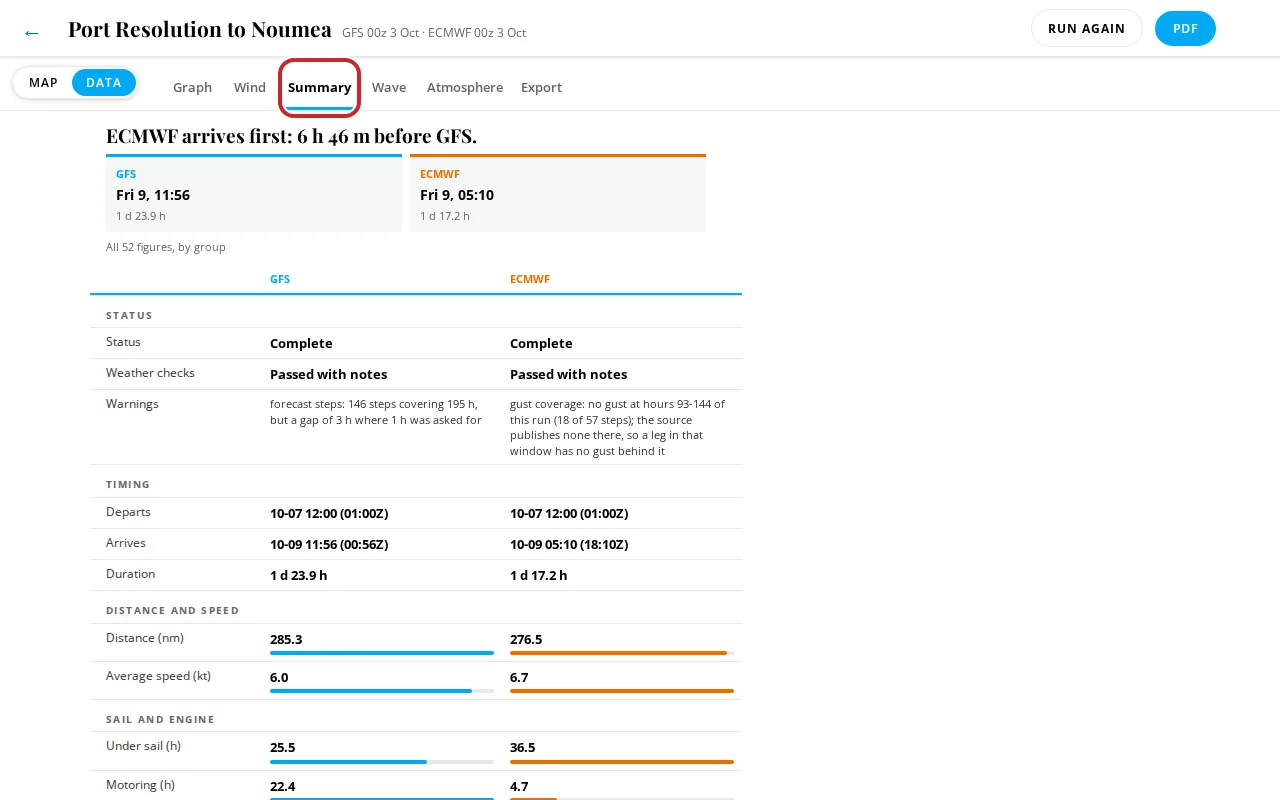
It opens with which model arrives first and by how much, and a card per model with its arrival and duration. Below, every figure for the models side by side, in groups: status, timing, distance and speed, sail and engine, tacks and gybes, wind, points of sail, weather, comfort, seas, limits, and how the route was found. A thin bar under each figure compares the models at a glance. This is where to compare models.
Wave
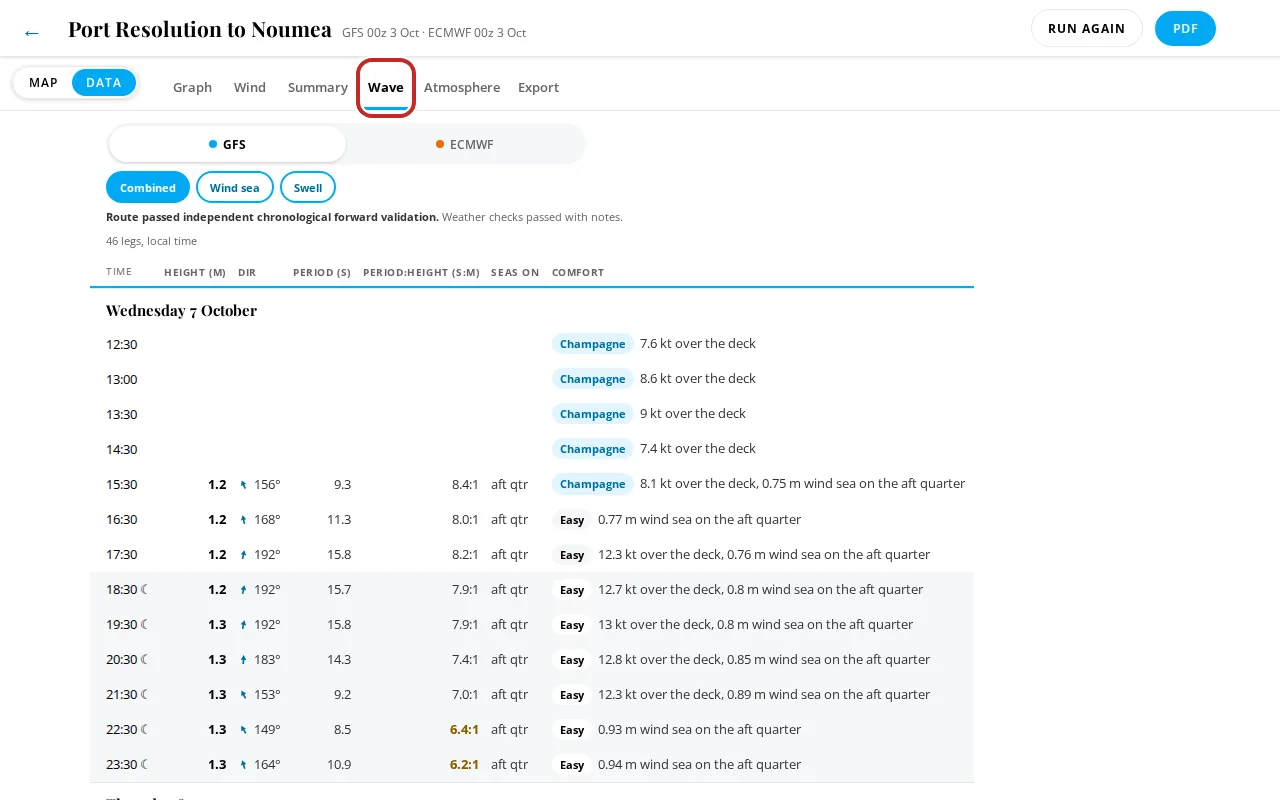
Wave height, direction and period per leg, with Period:height and which side of the boat the seas are on. Steep values are in amber; see Comfort. The comfort rating shows with its reason. Combined, Wind sea and Swell choose which part of the sea the table shows.
Current
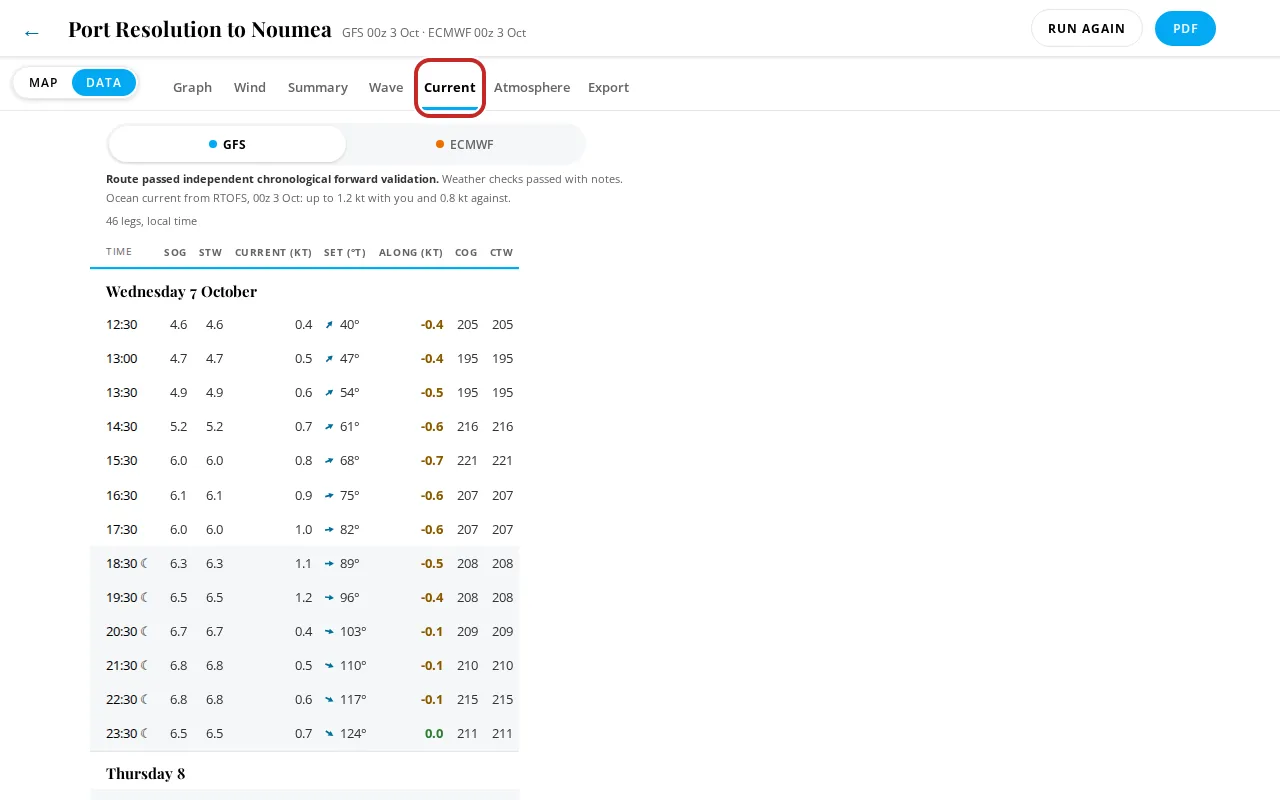
Shown for a route planned with current: speed over the ground and through the water, the current's speed and set with an arrow, how much runs with you (green) or against you (amber) along the course, and the course over the ground and through the water.
Atmosphere, Export and the planner's tabs
Atmosphere lists pressure, rain, CAPE, day or night, and where a model has them, air temperature, cloud and humidity; CAPE at or over the squall threshold is in amber. Export holds the GPX and CSV for the model you choose, the route PDF, and what to check before you follow the route (see Reports). A route made from a planner day also has Risk, the ensembles' numbers for that day, and Brief.
Comfort ratings
Every step of a route gets one of five comfort levels, best to worst:
| Level | Feels like |
|---|---|
| Champagne | Flat and steady. |
| Easy | Sleeping fine. |
| Coffee | One hand to move, still cooking. |
| Rough | Two hands, no cooking. |
| Sick | Nobody is sleeping. |
Each rating comes with its reason, the wind over the deck or the sea that decided it, for example 11.3 kt over the deck or 1.8 m swell on the bow. The ratings depend on the hull and length in Settings, Boat. How they're worked out is in Understanding: Comfort.
On the Android and iPhone apps
The route screen has the same Map and Data faces, and the same Data tabs. Tap a boat for its box, tap the map for the weather at a point (long-press to put the crosshair where you press), and use the round eye button to choose the model shown.
The layer picker has Disturbance and Storms as on the web. On Storms, each marker is labeled with the storm's name and wind and, under that, its issue time, and each forecast point with its hours ahead, for example +24 h. The note box sits in the first corner of the map, top first, where it covers no marker or label. It shows one line until you tap it for the whole list.
Android, a finished route on the Map face: the route key, the boat box open for the GFS boat, the timeline at the foot and the layer button.
Android, the same route on the Data face with the Summary tab open.